

Chart Anatomy is back from its summer break, so let’s restart with something basic, or something that only looks basic: the title. Writing a strong title is a skill, and in my classes it often takes longer to master than choosing the right chart or cleaning up its design. One clarification: by a better title, I mean the message above the chart. The chart still needs its own descriptive title. One helps people use the chart; the other helps them read it.
Students learn to sort bars quite quickly. They remove unnecessary gridlines, simplify colors, and label the important values.
Then the cursor starts blinking above the chart.
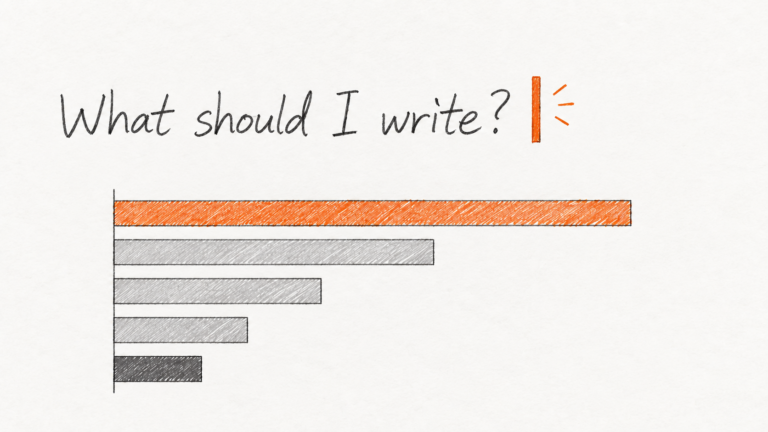
What should I write?
That one sentence is often the hardest part because it requires more than charting skills. It requires you to decide what the chart is actually saying, and why anyone should care.
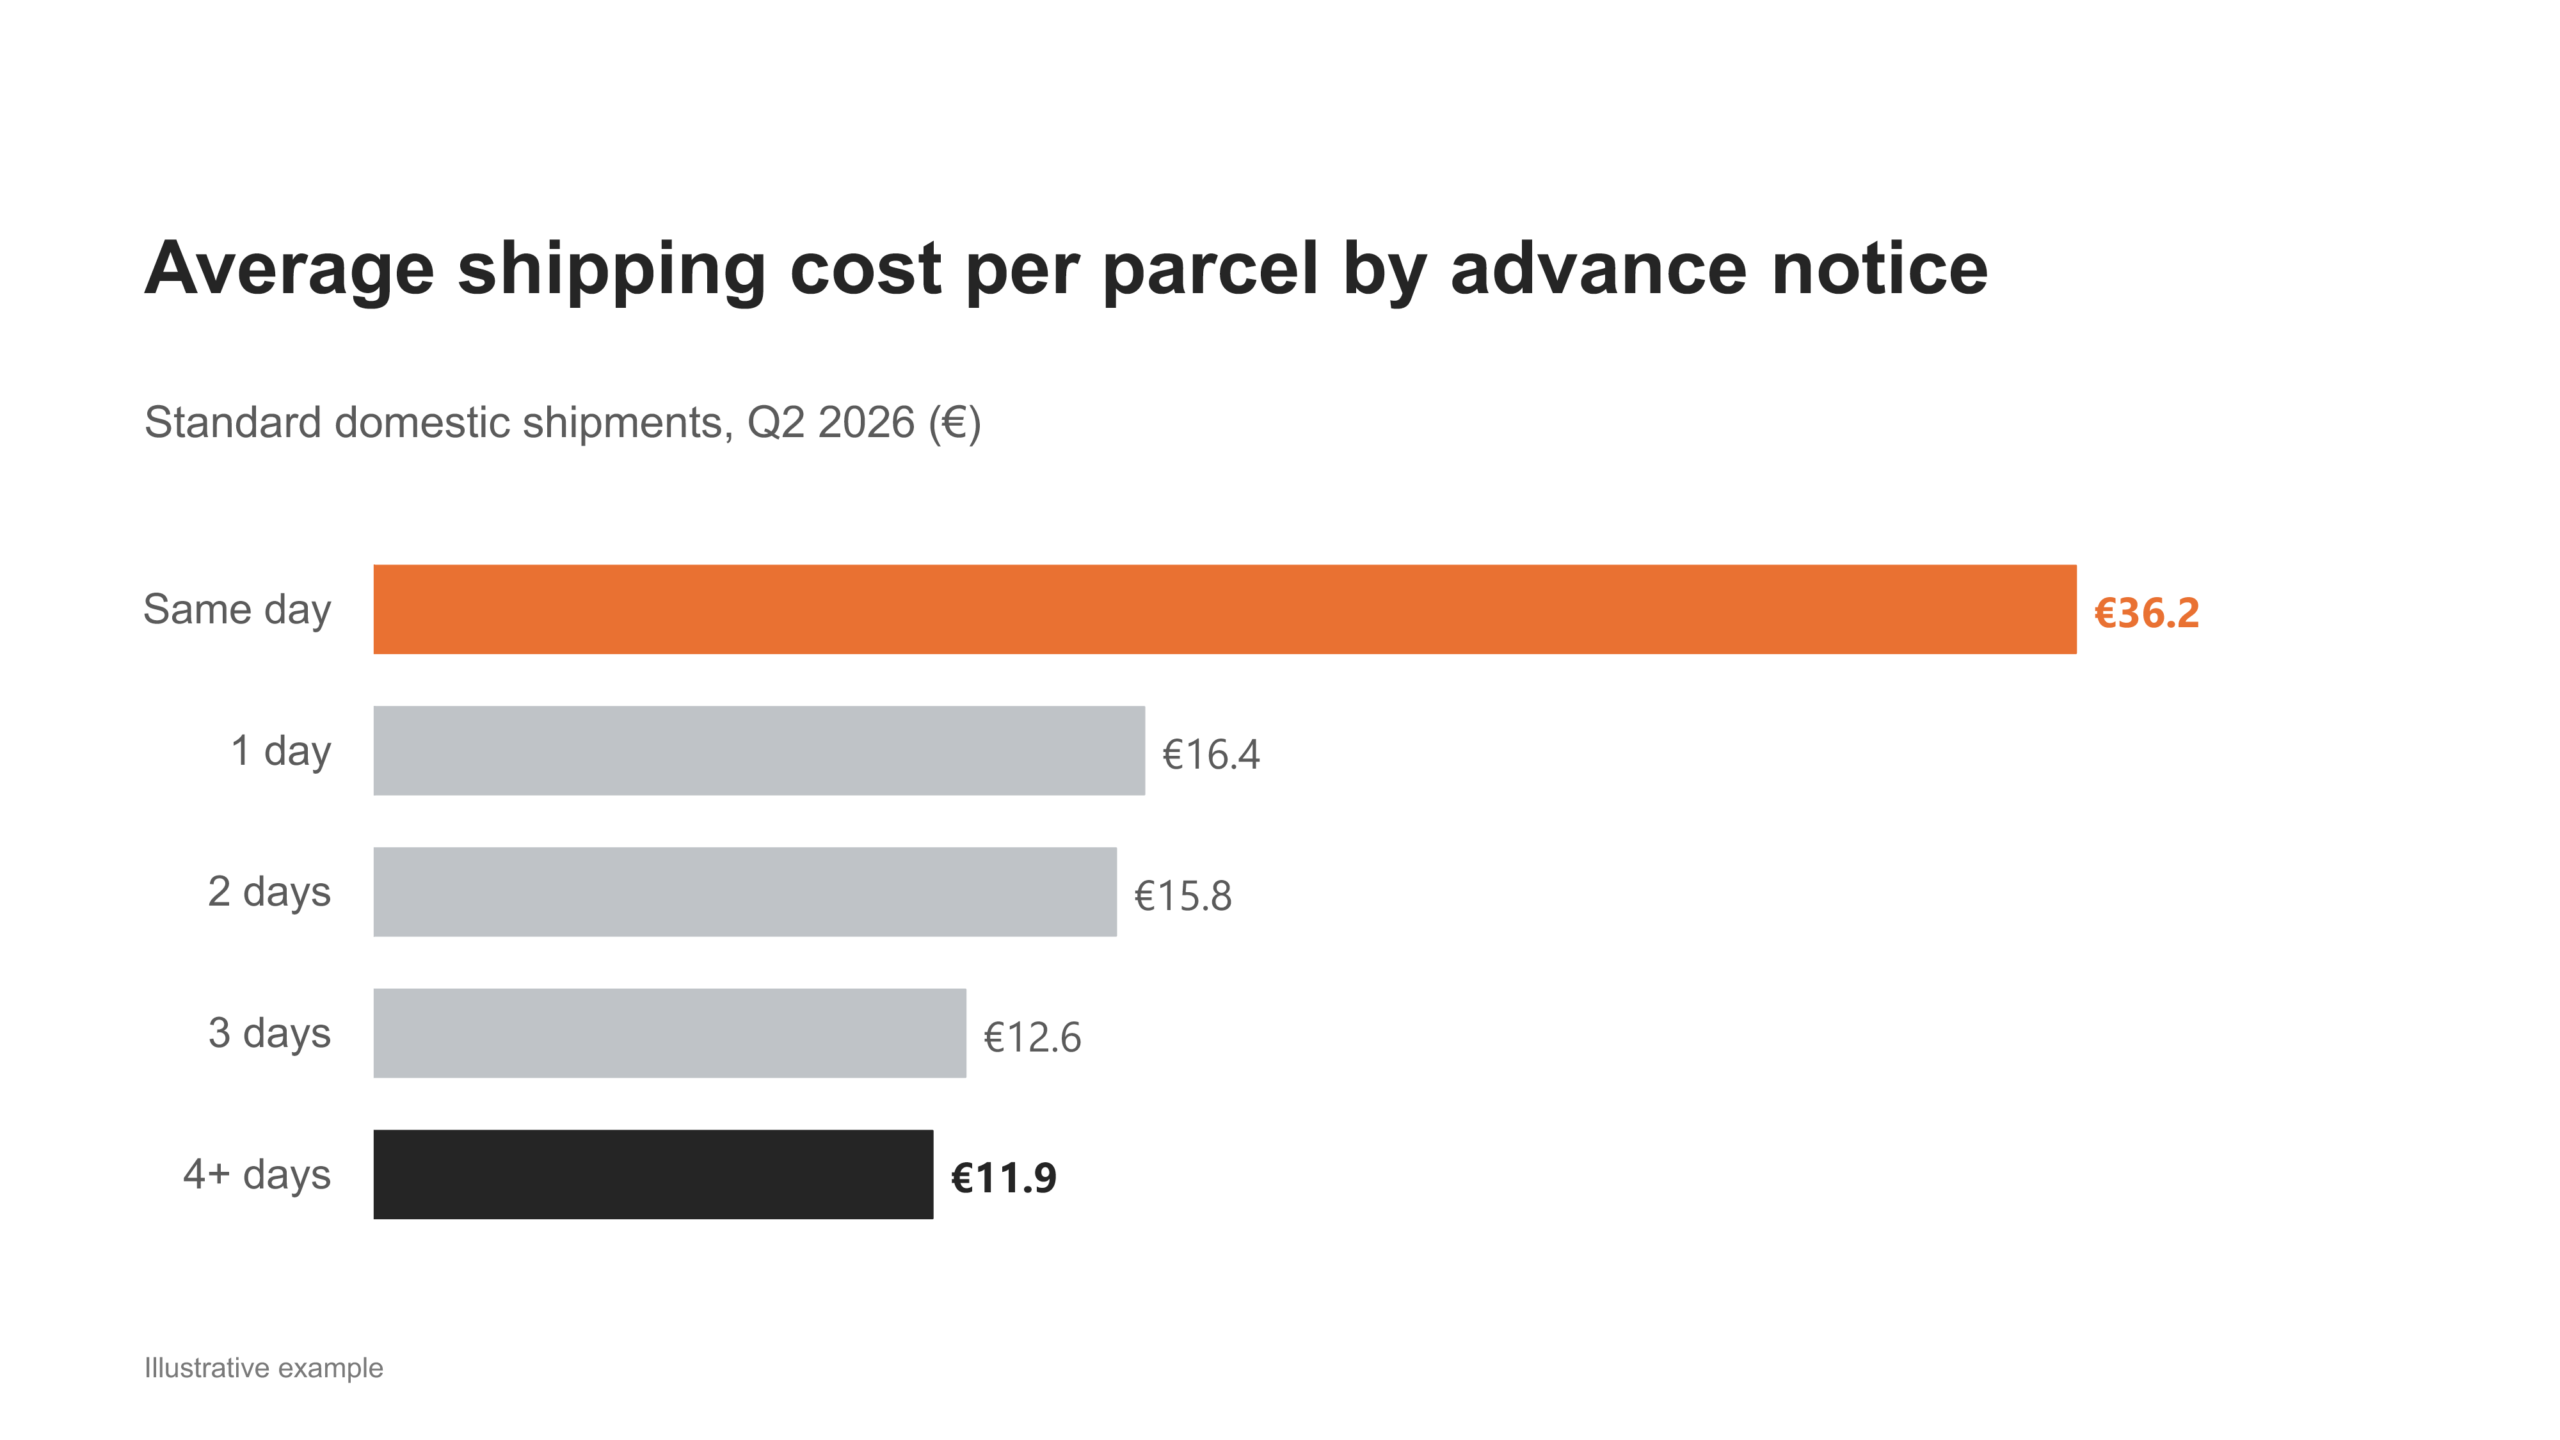
Imagine a sorted bar chart showing the average cost of shipping comparable domestic parcels. Advance notice means the number of days between submitting the request and dispatching the parcel.
The five categories are same day (€36.2), 1 day (€16.4), 2 days (€15.8), 3 days (€12.6), and 4+ days (€11.9).
The chart has a perfectly good descriptive title:
Average shipping cost per parcel by advance notice, standard domestic shipments, Q2 2026 (€)
The title is specific. The categories are clear. The unit and period are included.
Nothing is technically wrong.
And yet one important thing is missing:
Why are you showing me this chart?
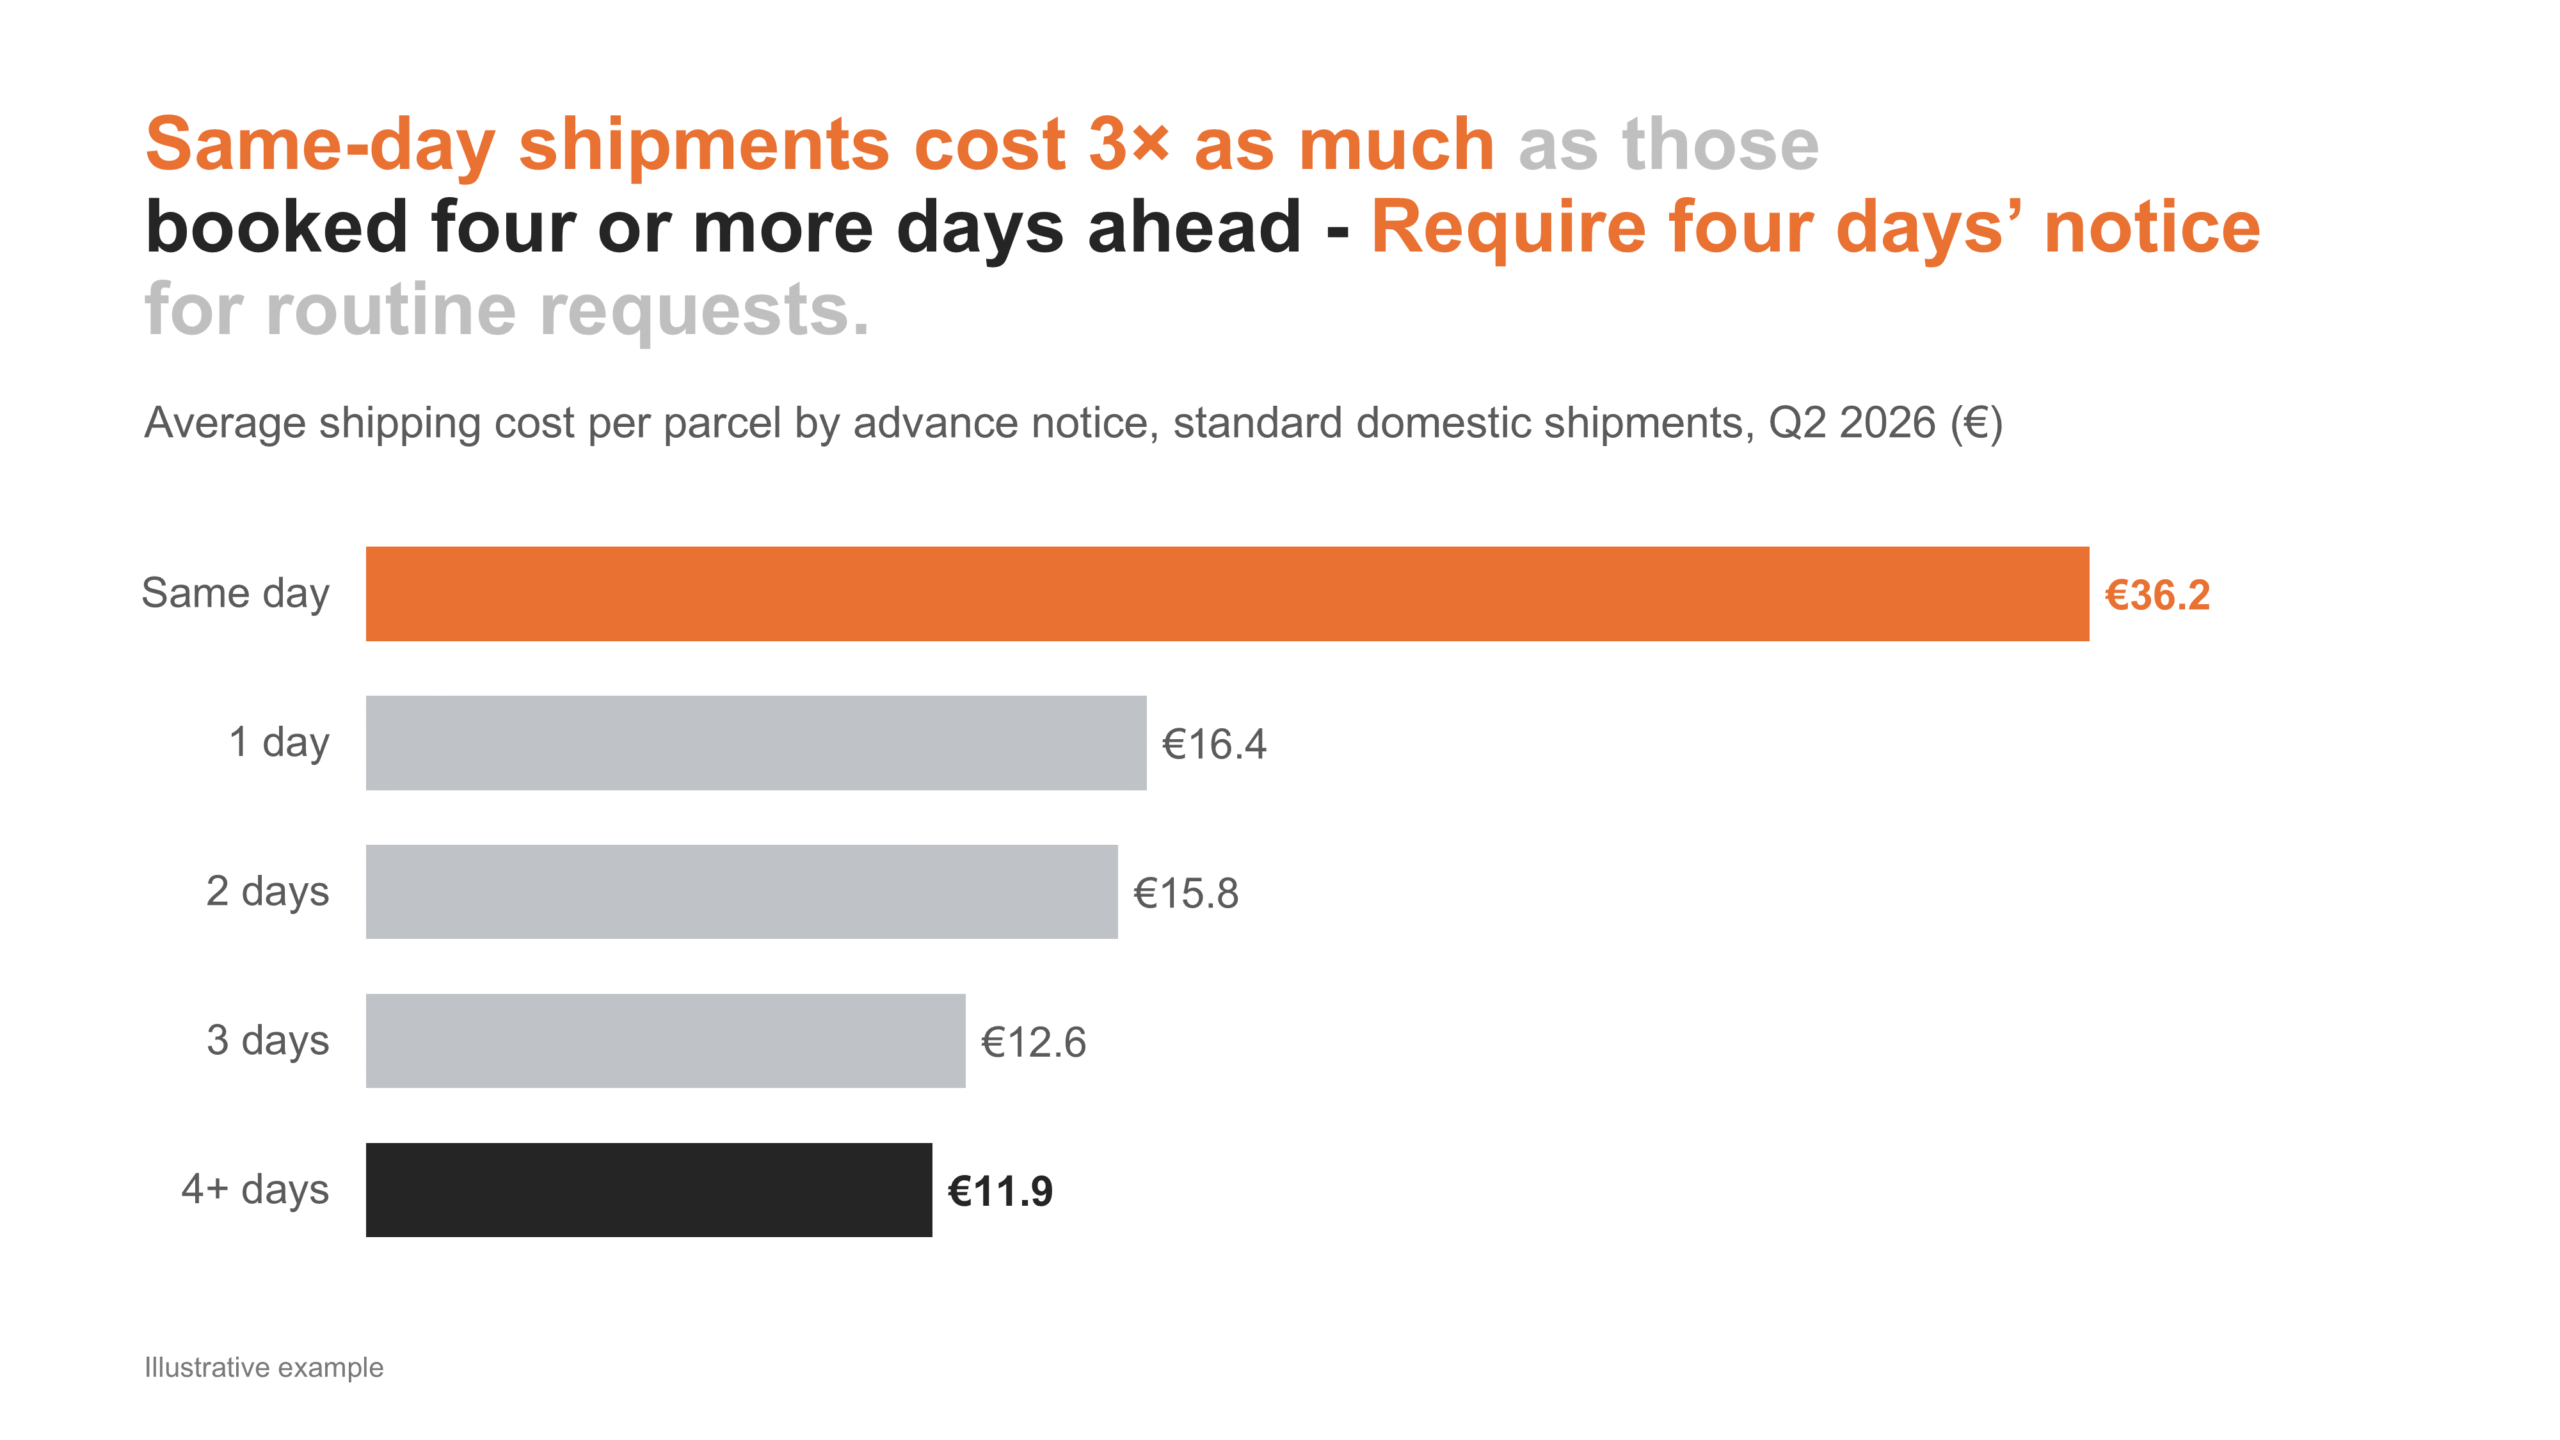
A busy reader still has to compare five bars, identify the meaningful difference, calculate that €36 is three times €12, and decide whether that matters.
The message does that work:
Same-day shipments cost 3× as much as those booked four or more days ahead. Require four days’ notice for routine requests.
Now we have even more than an observation.
We have the beginning of a decision.
That is the value of the message. It directs attention, explains why the finding matters, and helps the audience decide what to do next.
Three different jobs
The distinction is simple:
- The message answers: So what, and now what?
- The chart answers: Where is the evidence?
- The chart title answers: What exactly am I looking at?
The descriptive title is necessary, just like clear axes, units, dates, and labels. But it is not the strategic starting point.
The message is.
After the analysis, start with the message
This workflow begins only after the analysis is complete. We are not inventing a conclusion and then hunting for convenient evidence.
Once you know what the data says:
1. Write the message.
What should the audience understand, question, decide, or do?
2. Choose the explanatory chart.
What evidence supports the message, and which chart makes it easiest to see?
In our example, sorted bars reveal how shipping costs fall as advance notice increases. Emphasizing €36 and €12 makes the 3× comparison easy to verify.
3. Complete the labeling.
Add the descriptive chart title, axes, units, period, source, and any context needed to interpret the numbers correctly.
This final step is essential, but it is no more strategically important than remembering the unit of measure or labeling an axis correctly.
A practical challenge
Open your latest report and choose one chart.
Write one sentence that tells your audience what they should understand, question, decide, or do.
If you cannot write the message yet, the analysis may not be finished.
