

What’s wrong with this chart? More than you think.
 Sometimes a chart looks fine until you ask one simple question: what exactly am I looking at?
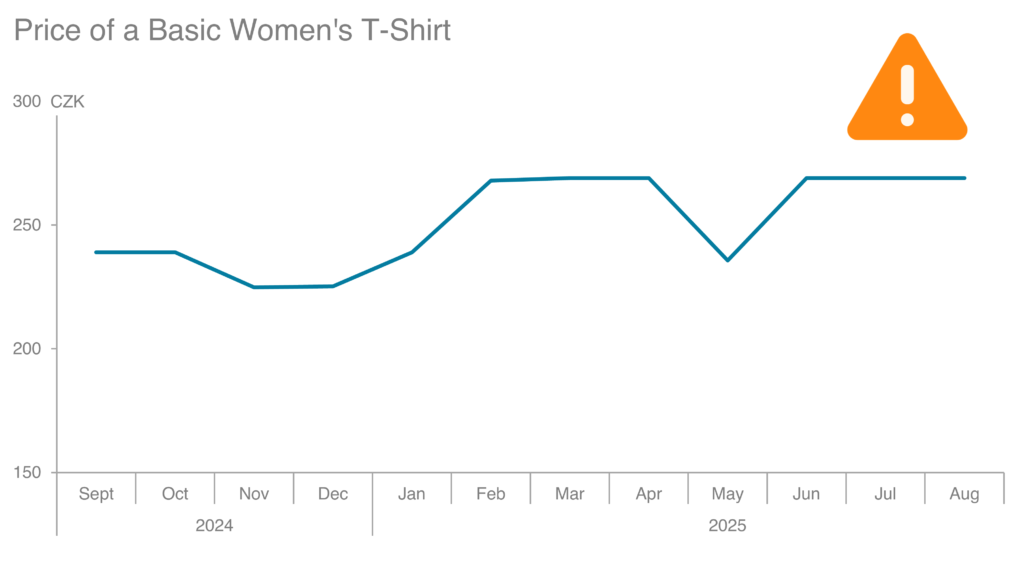
At first glance, the original chart looks perfectly reasonable.
It shows the price of a basic women’s T-shirt over time, and a line chart is usually a safe choice for time series. You could even argue that a column chart might work better for month-by-month comparison, but nothing feels obviously broken.
Then you pause for a second.
What is this chart actually showing?
If the x-axis is monthly, what is the metric behind each point? Is it the average price in that month? The end-of-month price? The price on a specific day? The 27th of each month, for example, since I’m writing this on April 27?
That is the first major issue.
The chart does not define the measure clearly enough. And if the measure is unclear, the chart is already on shaky ground. Before we discuss aesthetics, formatting, or labeling, we need to know what the data point represents.
That alone is a meaningful catch. If you spotted it, you were looking at the chart the right way.
But there is a second issue, and in my view it is even more important.
A line chart suggests continuous movement.
That is fine for many things: temperature, traffic, sales volume, or demand patterns. But does the price of a single retail item really behave like that?
Not usually.
A T-shirt price does not slowly glide upward from December into January and then continue a smooth climb through February. In reality, the price tends to stay fixed for a while, then change suddenly. It jumps up because of a price increase. It drops because of a promotion. It stays flat again. Then it changes again.
That is not a smooth process. It is a series of discrete steps.
Which means a line chart is telling the wrong story.
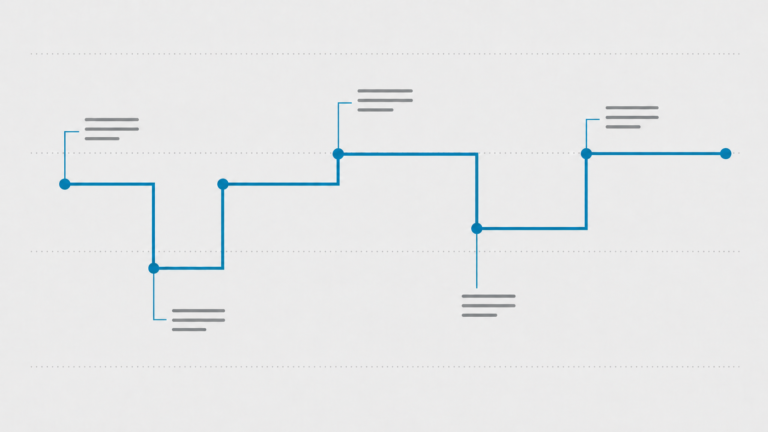
A step chart tells the right one.
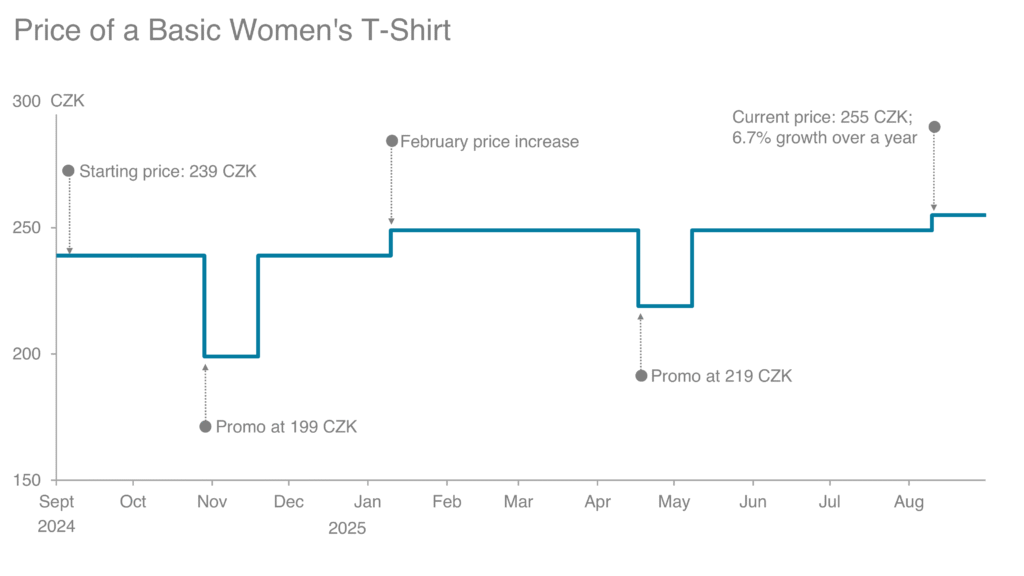 The original line chart implies gradual movement where none exists. The step chart shows the actual pricing behavior: flat periods interrupted by specific events. And once you switch to that view, the story becomes much clearer.
In this case, the year started at 239 CZK, then moved to a promotional price point of 199 CZK in November. After that came a February price increase, later another promotion at 219 CZK in May, and eventually a current price of 255 CZK, which represents 6.7% growth over the year.
That sequence tells a very different story from the original line.
Now we are no longer looking at a vague upward trend. We are looking at pricing decisions.
That is the real value of choosing the right chart type. Good data visualization makes the underlying business process visible.
And that is why I keep coming back to the idea that data visualization is a language.
If “step chart” is not yet part of your vocabulary, it probably should be.
Because once you learn this chart type, you start seeing many more places where it belongs.
Prices are one example, but far from the only one.
Think about inventory levels. Stock does not usually decline in a smooth curve. It stays the same, then drops when orders go out, then jumps when replenishment arrives.
Think about account balances. Think about interest rates. Tax bands. Subscription prices. Minimum wage requirements. Contracted tariffs. Credit limits. Service tiers. Any metric that stays fixed until a decision, event, or rule changes it is a candidate for a step chart.
And this matters because the wrong chart choice can quietly change the meaning of the whole communication.
A smooth line can make a process look organic, gradual, even predictable. A step chart can reveal that the same process is policy-driven, event-driven, or operationally discrete.
So the next time you are charting a metric over time, do not stop at the question, “Is this a time series?”
Go further:
Does this value move continuously, or does it change in steps?
That one decision can completely change the story your chart tells.
And once you see that, you start noticing step-chart problems everywhere.
If creating a step chart in Excel feels awkward, I have included a video link showing how to create one.