
Image was generated with Midjourney
The Truth About Dashboards: They're Not Analytical Tools
 3. 6. 2023
 olga
olga 4647 Views
Dashboards are like the Swiss Army knives of the business world – everyone thinks they can do everything, but they’re really only good for a few specific tasks. If you’re one of those people who thinks that dashboards are the be-all and end-all of business analysis, it’s time for a reality check. The truth is, dashboards are great for monitoring and explaining operational performance, but they’re not a replacement for analytical tools.
Stephen Few, author of “Information Dashboard Design,” knows what’s up. He originally, back in 2006, classified dashboards into three categories: Strategic, Analytical, and Operational. But by the time the second edition of his book came out in 2013, he’d changed his mind. He realized that dashboards were excellent for monitoring performance, but not for in-depth analysis. And guess what? I’m with him on that.
So, let’s explore when dashboards are essential and when you need to bring out the big guns. I love dashboards – don’t get me wrong – and there are plenty of business cases for them. But you need to know their limitations if you want to make the most of them.
The Dashboard Zone
Picture a chart with four quadrants. The x-axis represents Strategic vs. Operational, while the y-axis represents Exploratory vs. Explanatory. Dashboards are only suitable for the explanatory analysis of operational performance. That’s what I call the “dashboard zone.”
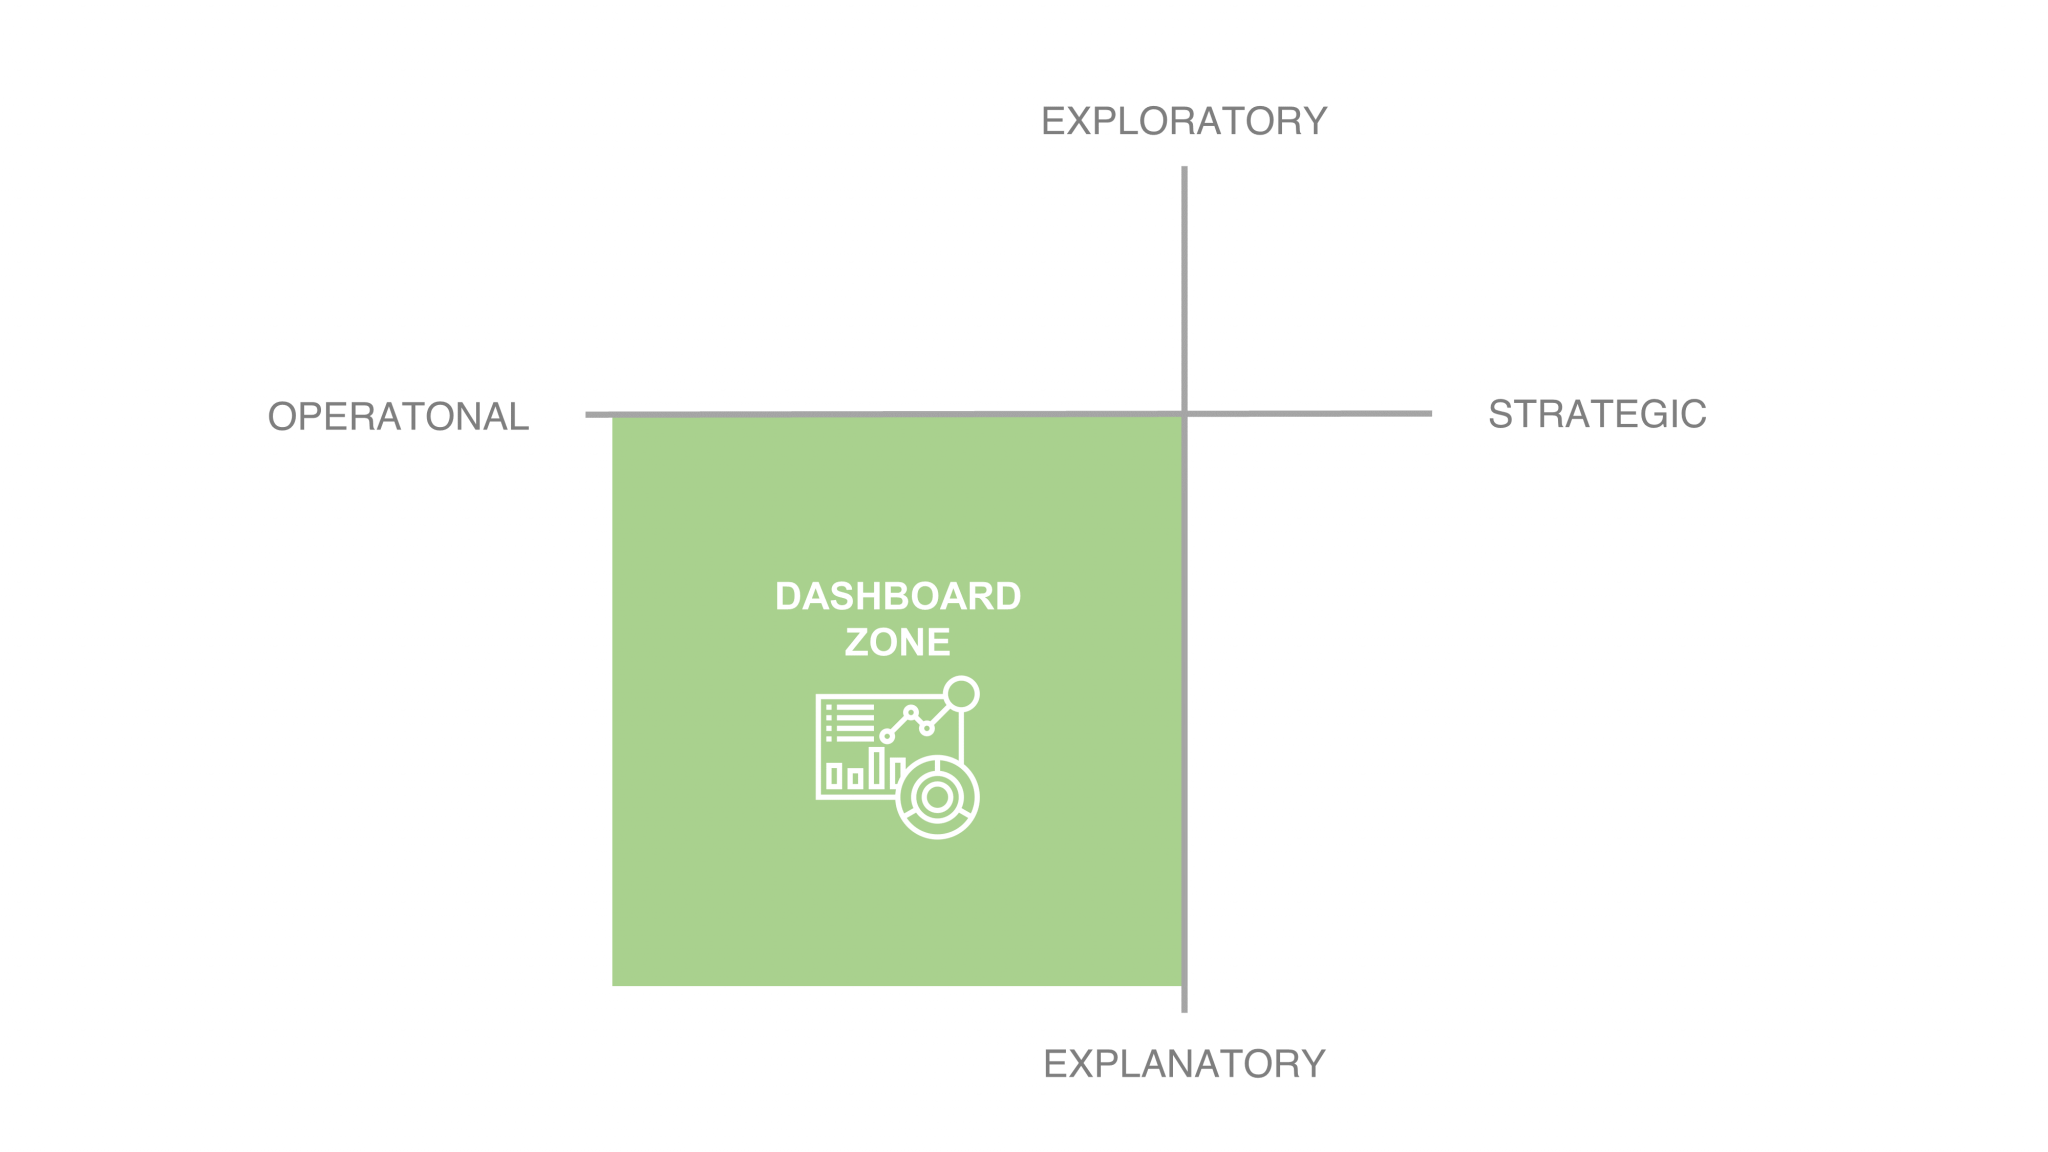
Operational Explanatory
First things first: dashboards are amazing at monitoring and explaining operational (not strategic) performance. Most business problems fall into this category, and that’s where dashboards shine. The dashboard zone is huge and critical for timely decision-making across every business function.
Dashboards can answer questions like: Why did our profit margins decrease despite an increase in revenue? Why are our marketing campaigns not generating the expected ROI? How many customers canceled their subscriptions and why?
Well-designed driver-based dashboards should combine key performance metrics with their influencers – business drivers that help you understand why an unexpected change occurred. For example, business drivers affecting a company’s margin rate could include a shift in product mix towards low-margin products, volume discounts, early payment discounts, changes in purchase prices due to raw materials or energy prices, or changes in transportation and logistics costs due to fuel prices.
But let’s be real: when you’re interacting with a dashboard or adjusting filters and timeframes, you’re not performing real analytics. All the analytics has already been done at the dashboard design stage or even earlier during exploration.
Operational Exploratory
Exploring operational performance is where analytics happens. Operations managers, data scientists, and business analysts are searching for answers to questions like: What are our key sales drivers? How can we optimize our supply chain to reduce costs? How can we reduce customer churn?
This is where statistical and machine learning tools come in – not dashboards. The data used in this exploration (both internal and external) should come from the company’s data warehouse. The same data we use to understand relationships, causality, and influence between key metrics and business drivers will later be useful in our dashboards for regular monitoring, exploration, and contribution analysis.
Strategic Explanatory
You might be thinking, “If I use dashboards to monitor and explain operational performance, why can’t I do the same with strategic performance?” The short answer is that you can, but only for the monitoring part. It’s unlikely that questions like “Why are customers choosing our competitors over us?” or “Why is our employee turnover rate higher than industry standards?” can be answered using only internal data.
Sure, you can and should gather not only internal but also external market and competition data. Keep an eye on metrics like competitor prices and promotional activities; they serve as crucial explanatory factors in operational dashboards. However, let’s face it: the sheer volume and diversity of data required for strategic explanations are unlikely to be readily available. When it comes to strategic explorations, business analysts, with the support of senior managers, must seek plausible explanations beyond the confines of company dashboards.
Strategic Exploratory
Here, dashboards find themselves out of their depth, unable to provide satisfactory answers to questions like: What are the emerging trends in our industry? What is the market potential for a new product? What are our competitors up to? To conquer this land of uncertainties, market research, strategic analysis, and the aid of advisors and consultants should be used.
Conclusion
Though dashboards may have limitations in the grand scheme of analytics, their indispensable role in monitoring and explaining operational performance cannot be undermined. They unlock a multitude of use cases and opportunities within their realm. However, let us not burden them with the weight of true exploratory analysis. Instead, harness their strengths, leaving the task of in-depth exploration in the capable hands of other analytical tools.